The Board Deck That Writes Itself: A CRO’s Guide to Real-Time Risk Quantification
Table of Contents
Every quarter, your risk team spends 3–5 analyst days assembling the board deck. They pull data from six different systems, manually reconcile vulnerability counts, debate whether to call something “high” or “critical,” and deliver a PDF that is already stale by the time the board convenes. Meanwhile, the SEC’s 4-day disclosure rule is ticking, the average breach costs $4.45M, and your board is asking for numbers—not heat maps. This walkthrough shows how ComplianceHarbor replaces that entire cycle with continuous, FAIR-aligned cyber risk quantification that updates in real time.
1. The Business Problem
CROs face a convergence of pressures that traditional GRC platforms were never designed to handle:
- SEC 4-day disclosure mandate: The SEC requires material cybersecurity incidents to be disclosed within four business days on Form 8-K. To comply, you need to know your risk posture continuously—not quarterly. A heat map that says “high” does not tell you whether an incident is material.
- $4.45M average breach cost: The IBM/Ponemon 2024 Cost of a Data Breach Report puts the global average at $4.45M, with healthcare at $10.0M and financial services at $5.9M. Boards want to know: what is our annualized loss exposure, calibrated to our industry and threat surface?
- 3–5 analyst days per board cycle: Every quarter, your team manually assembles risk data from vulnerability scanners, threat feeds, compliance tools, and incident logs. The output is a static snapshot that cannot answer follow-up questions and cannot be independently verified.
The result is a governance gap: the board needs defensible financial figures to fulfill its fiduciary duty, but the risk team is delivering subjective assessments that cannot withstand regulatory scrutiny.
2. The Demo Walkthrough
Here is exactly what happens when you run the ComplianceHarbor demo—the same flow your team would use in production, but against a sample change request for an Exchange Server 2019 deployment on Azure.
Step 1: Assess Change Risk
The platform ingests the change request parameters—system identifier, environment, cloud provider, technology stack—and simultaneously queries 26 external intelligence sources. Within seconds, you have a composite risk score with threat surface tags showing exactly which external factors are contributing to risk.
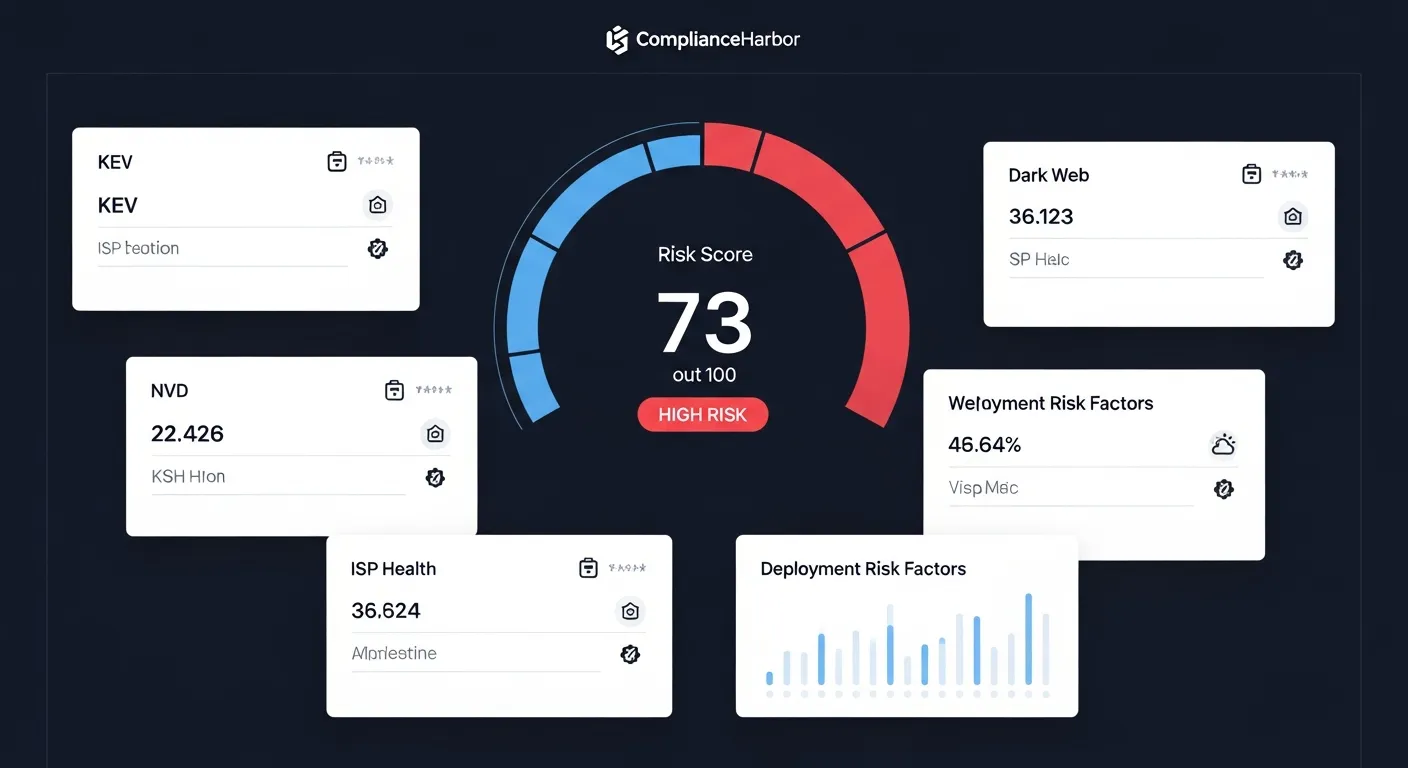
This is not a subjective rating. The score of 73/100 (HIGH RISK) is computed from weighted inputs across vulnerability databases (CISA KEV, NVD), active threat campaigns (MITRE ATT&CK TTPs), environmental conditions (weather, power grid), and third-party exposure (dark web, supply chain). Every input is timestamped and auditable.
Step 2: Cyber Risk Quantification (CRQ)
With the risk score computed, ComplianceHarbor automatically runs FAIR-aligned quantification to translate that score into financial figures your board can act on.
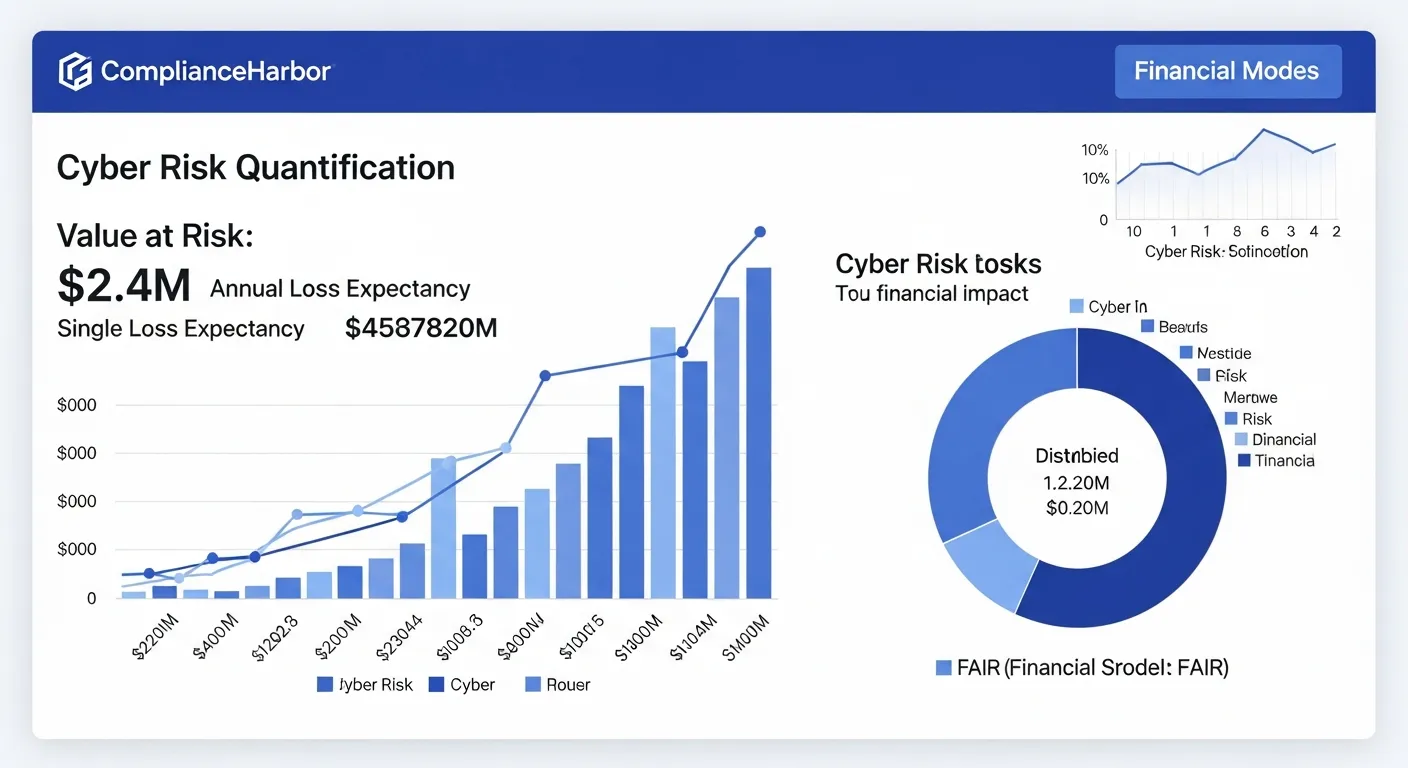
The output gives you exactly what the board needs:
- Value at Risk: $2.4M — the total financial exposure from this change scenario
- ALE (Annualized Loss Expectancy): $890K — the expected annual cost of this risk
- SLE (Single Loss Expectancy): $1.2M — the cost if a single loss event occurs
- ARO (Annualized Rate of Occurrence): 0.74 — the expected frequency of loss events per year
The loss magnitude breakdown further decomposes impact into productivity loss ($420K), response costs ($380K), replacement costs ($290K), and competitive advantage loss ($310K)—each calibrated to industry-specific cost multipliers from IBM/Ponemon and Verizon DBIR data.
Step 3: Suggest Optimal Change Windows
Risk quantification alone is not enough. The CRO also needs to know: when should we proceed to minimize exposure? ComplianceHarbor’s suggest_change_windows tool analyzes timing risk, baseline risk, and remediation requirements to recommend optimal deployment windows.
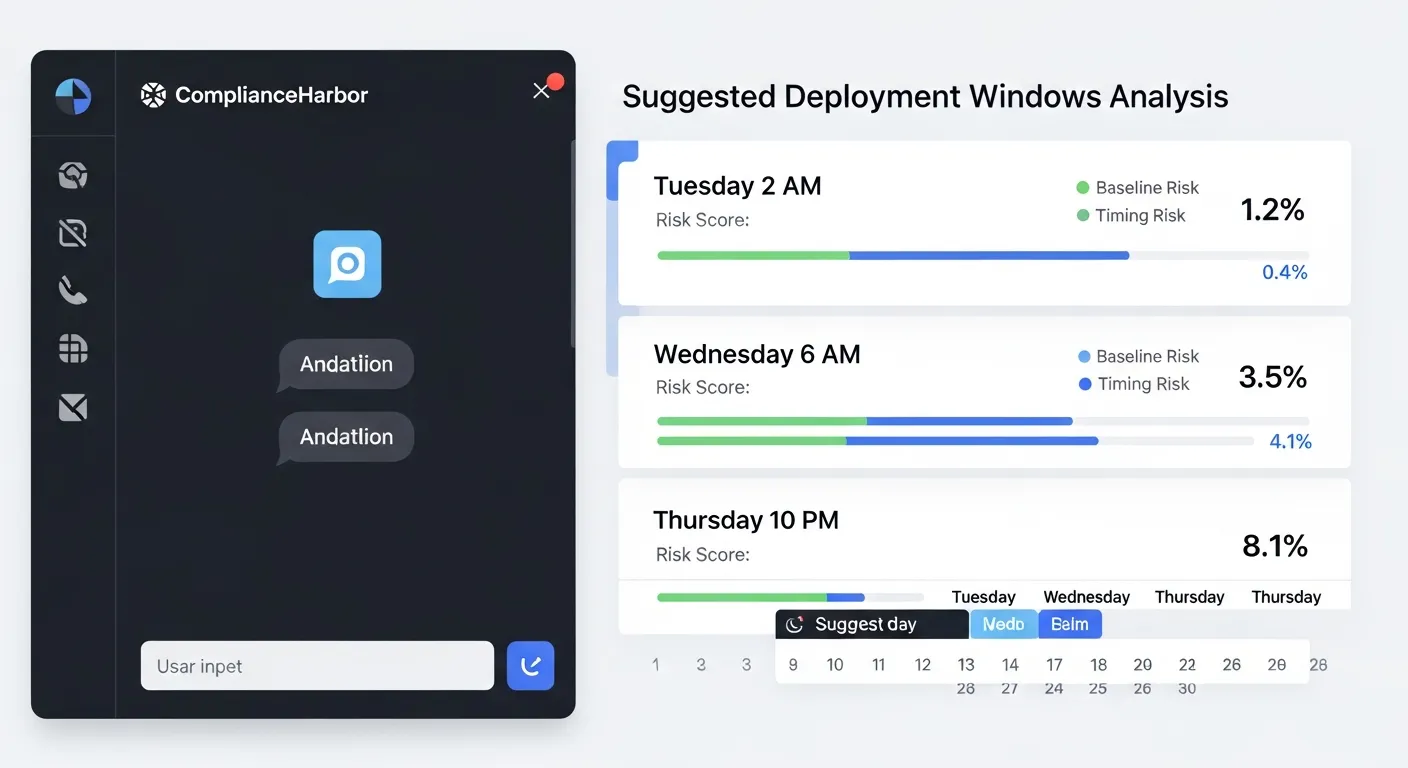
The tool returns ranked windows with split scoring—a timing score (how favorable the time slot is based on patch cycles, vendor maintenance windows, and threat activity) and a baseline score (the residual risk from unresolved vulnerabilities and compliance gaps). Remediation items are surfaced alongside each window so your team knows exactly what to address before proceeding.
Step 4: Generate Evidence Receipt
Every assessment automatically produces a SHA-256 hashed evidence receipt that captures the complete decision context—inputs, scoring rationale, external conditions, and the operational decision made. This receipt is mapped to applicable compliance controls (SOC 2 CC8.1, ISO 27001 A.12.1.2, PCI-DSS Req. 6) and stored with an immutable integrity hash. For the CRO, this means the board deck is not just informative—it is a defensible audit trail that regulators and auditors can independently verify.
3. The Board Deck Report
ComplianceHarbor now generates a dedicated Board Deck report type—the 10th report format available through the platform. Unlike the executive summary (designed for operational stakeholders), the Board Deck is purpose-built for board-level governance audiences and structured around the questions directors actually ask.
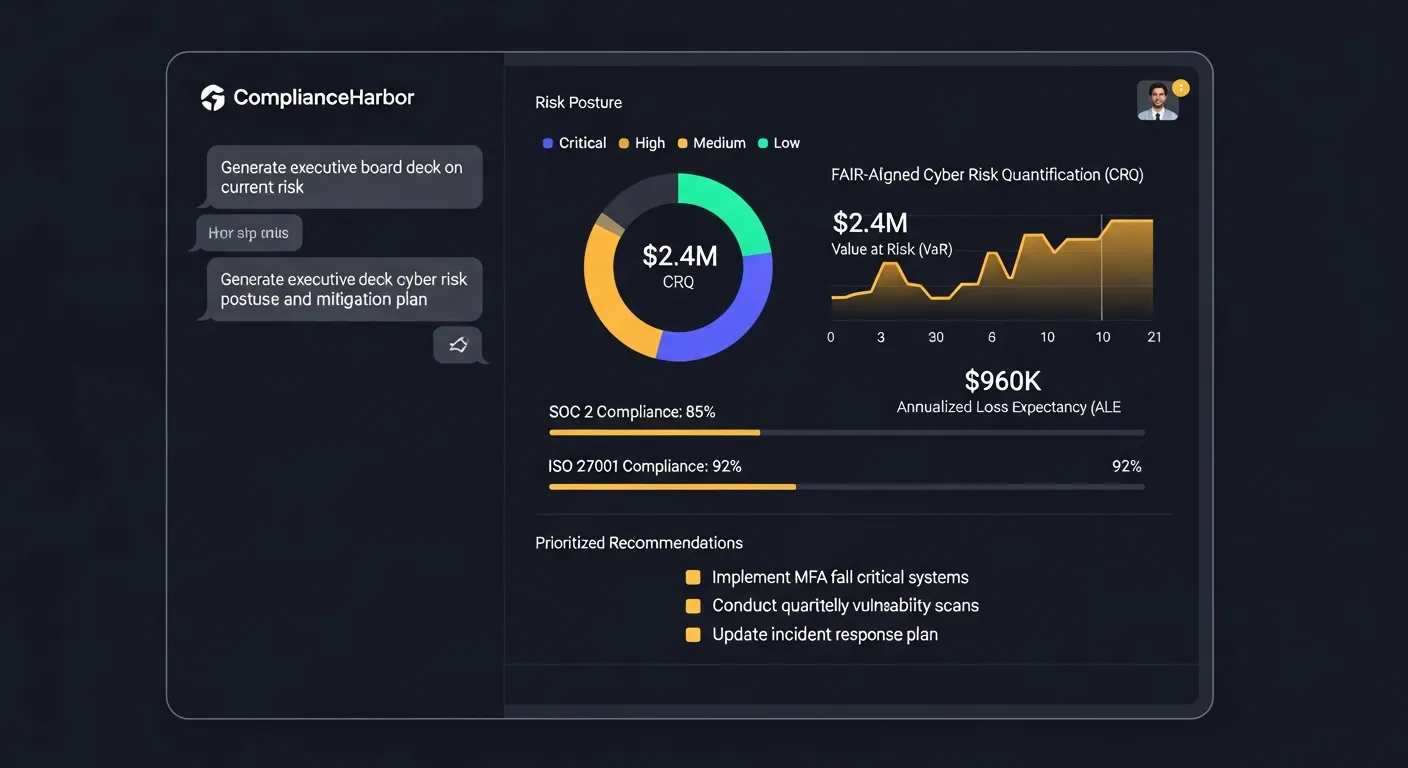
The Board Deck report includes five core sections:
- Executive Summary: A plain-language overview of organizational risk posture with the composite risk score and trend direction, written for a non-technical audience.
- Risk Posture: Current risk score with contributing factors, threat surface tags, and period-over-period comparison showing whether risk is increasing, stable, or decreasing.
- CRQ Financials: FAIR-aligned Value at Risk, ALE, SLE, and ARO figures with loss magnitude breakdown—the same defensible numbers shown in Step 2, automatically formatted for board presentation.
- Compliance Status: Framework-by-framework compliance posture across SOC 2, ISO 27001, PCI-DSS, and other applicable standards, with control coverage percentages and gap identification.
- Recommendations: Prioritized action items ranked by risk reduction impact, each linked to specific findings and estimated remediation effort.
To generate a Board Deck, use the generate_report MCP tool with report_type: "board_deck". The report is available at a shareable URL for 24 hours—no login required for board members to review.
4. Remediation Trends & ALE Tracking
Board-level risk reporting is incomplete without visibility into remediation progress. ComplianceHarbor’s Remediation Workflow Engine automatically creates tracked findings from every assessment that exceeds risk thresholds, and surfaces ALE trend data that shows the board how financial exposure is changing over time.
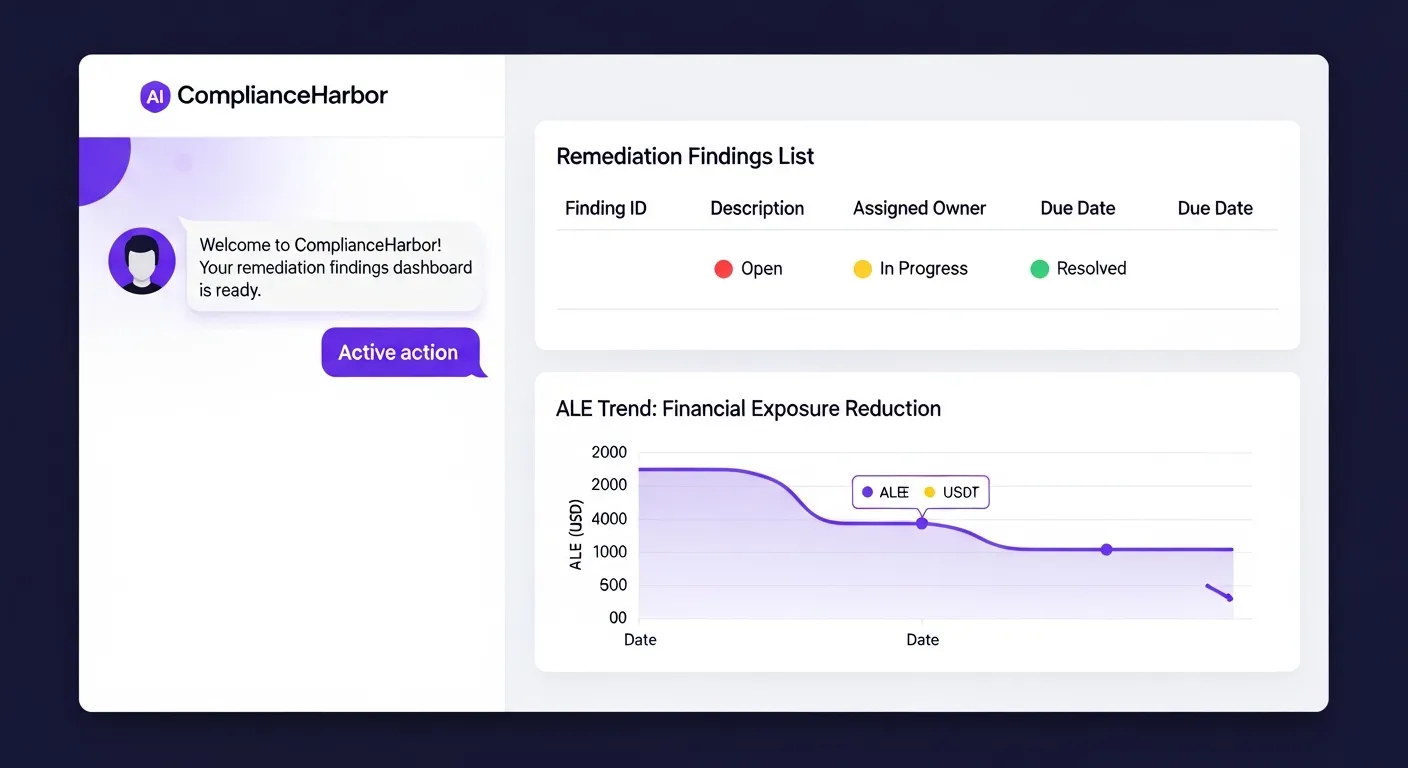
In a board context, the remediation trend data answers the question every director asks: “Are we getting better or worse?”
- Finding Lifecycle: Each remediation finding moves through a tracked status lifecycle—open → in_progress → resolved/accepted—with SHA-256 evidence receipts generated at resolution for audit trail integrity.
- ALE Trend Charts: The
/api/v1/remediations/trendendpoint returns time-series ALE data that shows how annualized loss expectancy is trending as findings are resolved. This data feeds directly into the Board Deck report’s risk posture section. - Automated Finding Creation: When an assessment produces a risk score above configurable thresholds, the platform automatically creates remediation findings via the
create_remediation_findingsMCP tool—no manual triage required.
For the CRO, this means the Board Deck includes a live remediation status summary: how many findings are open, how many are being actively worked, and how the organization’s financial risk exposure is trending quarter over quarter.
5. Internal Control Posture
Board-level risk metrics are only as strong as the control data feeding them. ComplianceHarbor’s Internal Control Connectors ingest real-time signals from your existing security infrastructure and translate them into board-ready metrics mapped to compliance frameworks.
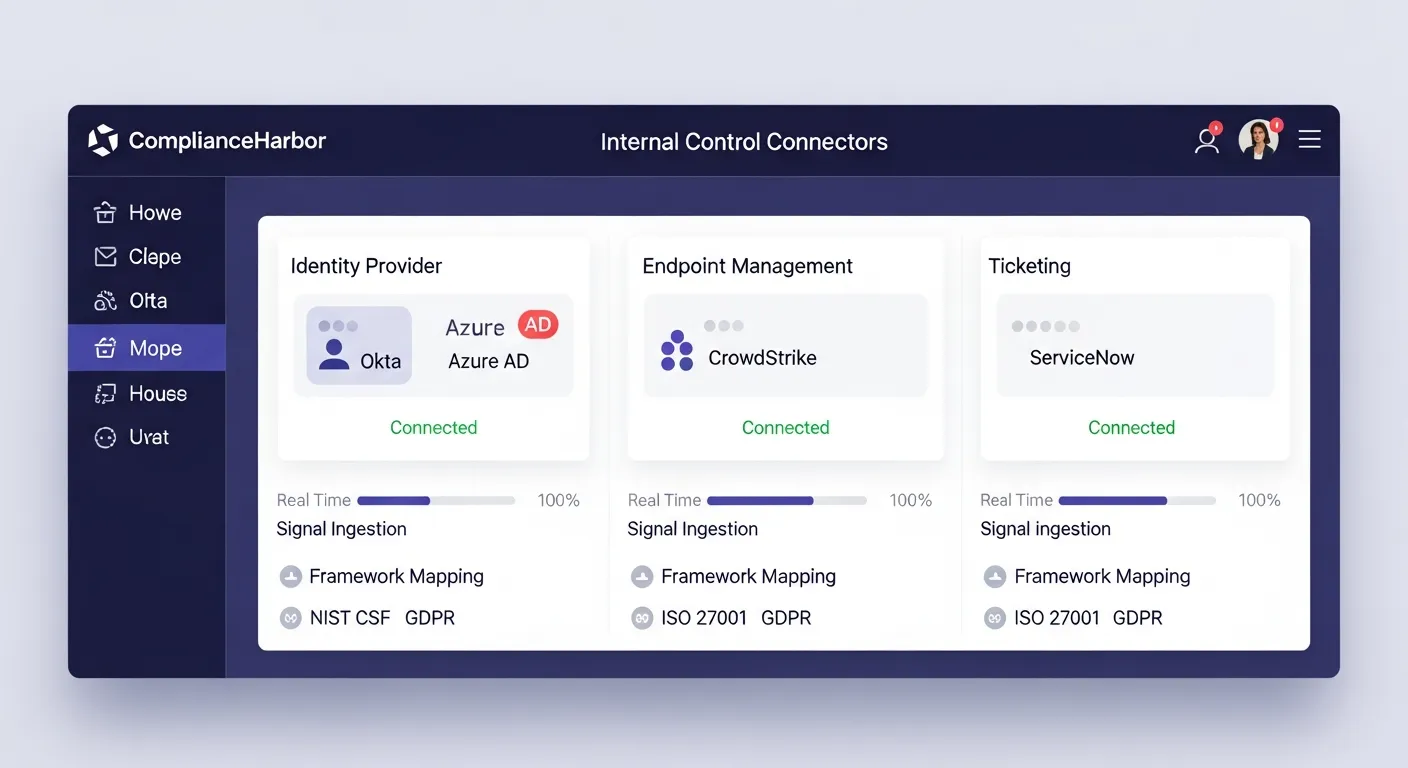
Three connector types feed board-level metrics:
- Identity Connectors (Okta, Azure AD): MFA enrollment rates, access review status, and privileged account metrics—mapped to SOC 2 CC6.1 and NIST CSF PR.AC-1. The board sees identity control effectiveness as a percentage, not a heat map color.
- Endpoint Connectors (CrowdStrike, Defender): Patch compliance rates, EDR coverage percentages, and endpoint health scores—mapped to NIST CSF DE.CM-08 and SOC 2 CC7.1. These figures feed directly into the Board Deck’s risk posture section.
- Ticketing Connectors (ServiceNow, Jira): Change approval rates, open priority ticket counts, and SLA compliance—mapped to ITIL 4, SOC 2 CC8.1. The board gets operational governance metrics alongside financial risk data.
Control connector signals are automatically included in evidence generation and Board Deck reports. When the board asks “What is our MFA adoption rate?” or “How many endpoints are unpatched?”, the answer is already in the deck—sourced directly from your production infrastructure, not a spreadsheet.
6. Tools Included in BoardView
ComplianceHarbor provides 48 MCP tools across the platform. The demo walkthrough exercises the following core tools, each returning structured, machine-readable data that feeds directly into board reporting:
| MCP Tool | What It Returns | Board Deck Value |
|---|---|---|
| assess_change_risk | Composite risk score (0–100), threat surface tags, conflict list with severity badges, risk label | Current risk posture with quantified severity and contributing factors |
| quantify_cyber_risk | ALE, SLE, ARO, Value at Risk, loss magnitude breakdown by category | Financial figures for capital allocation and fiduciary reporting |
| suggest_change_windows | Ranked deployment windows with timing scores, baseline scores, remediation items | Actionable recommendations for risk-optimized scheduling |
| generate_evidence_receipt | SHA-256 hashed receipt with framework control mappings, timestamps, integrity verification | Immutable audit trail for regulatory compliance |
| check_ransomware_exposure | Ransomware-linked KEVs, breach exposure, active campaigns, risk score | Quantified ransomware exposure for board-level risk reporting |
| map_attack_surface | TTP-to-CVE mappings, technique exposures, known threat actors, attack surface score | Attack surface quantification for fiduciary risk oversight |
| generate_report | Server-rendered report (board_deck type): executive summary, risk posture, CRQ financials, compliance status, recommendations | Auto-generated, shareable Board Deck for governance audiences |
| create_remediation_findings | Tracked findings with severity, ownership, and ALE impact from assessment results | Automated remediation tracking with board-visible ALE trends |
| ingest_identity_signals | MFA enrollment, access review status, privileged account metrics from Okta/Azure AD | Identity control posture metrics for board-level compliance reporting |
| ingest_endpoint_signals | Patch compliance, EDR coverage, endpoint health from CrowdStrike/Defender | Endpoint security posture feeding Board Deck risk metrics |
| ingest_ticketing_signals | Change approval rates, open priority tickets, SLA compliance from ServiceNow/Jira | Operational governance metrics for board oversight |
7. Sample API Response
Below is the actual shape of the CRQ response from the quantify_cyber_risk tool. This is the data that populates the financial figures shown in the demo:
{
  "value_at_risk": "$2.4M",
  "annualized_loss_expectancy": {
    "ale": "$890K",
    "min": "$620K",
    "max": "$1.1M"
  },
  "single_loss_expectancy": "$1.2M",
  "annualized_rate_of_occurrence": 0.74,
  "loss_magnitude_breakdown": {
    "productivity_loss": "$420K",
    "response_costs": "$380K",
    "replacement_costs": "$290K",
    "competitive_advantage_loss": "$310K"
  },
  "risk_factors": {
    "kev_exposure": 3,
    "nvd_critical_cves": 7,
    "active_threat_campaigns": 2,
    "dark_web_mentions": 1,
    "supply_chain_risk_score": 62
  },
  "industry_calibration": "technology",
  "confidence_level": 0.85,
  "assessment_timestamp": "2026-03-07T14:32:18Z"
}
Every field is derived from real-time intelligence—not static inputs. The risk_factors object shows exactly which external conditions are driving the financial figures, giving the board full traceability from dollar amount back to source intelligence.
8. The Bottom Line
The board deck that used to take 3–5 analyst days now generates itself—continuously, with every change event, from real-time intelligence. The dedicated Board Deck report type pulls together FAIR-aligned CRQ financials, remediation trend data, and internal control posture metrics into a single, auto-generated document purpose-built for governance audiences.
Every assessment produces an immutable, SHA-256 hashed evidence receipt mapped to applicable compliance controls. Every financial figure traces back to timestamped intelligence sources. Every deployment decision is documented with the risk conditions that existed at the moment of decision. Remediation findings are tracked from creation to resolution with ALE trend visibility, and internal control signals from your identity, endpoint, and ticketing infrastructure flow directly into board-level metrics.
Your board gets numbers. Your auditors get evidence. Your risk team gets their week back.
Generate a Shareable Board Deck or Executive Summary
Every assessment can produce a shareable, server-rendered report via the generate_report tool—choose board_deck for governance audiences or executive_summary for operational stakeholders. Reports are available at a shareable URL (/report/:requestId) for 24 hours, giving you time to share directly with board members, auditors, or executive stakeholders—no login required.
Get Started
Run the same assessment shown in this walkthrough against your own change requests.
Start Free Trial →Ready to get started with BoardView?
See pricing →